Coachella Valley Housing Report – January 2024
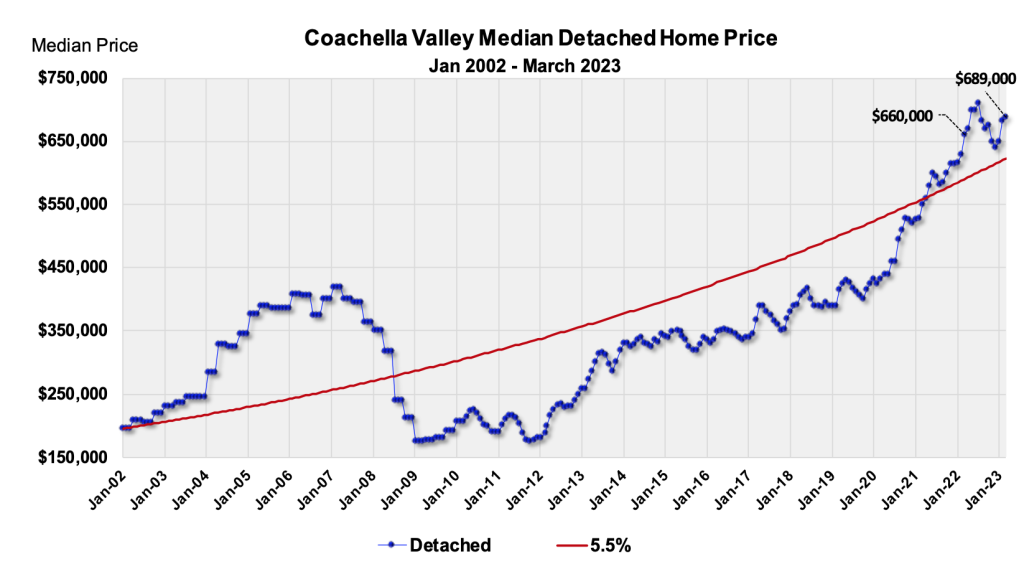
The median price of a detached home in the Coachella Valley in January was $660,000, down 1.8% year over year. The median price of an attached home in January was $475,000, up 9.2% year over year. Prices for detached homes continue to show wide variance in gains, which range from a 9.0% gain in Indian Wells to a decline of 11% in Bermuda Dunes. Four cities – Indian Wells, Indio, Palm Springs, and Rancho Mirage – had gains in their average size attached home. Prices often begin to rise in January, and we think this seasonal pattern has started this year.
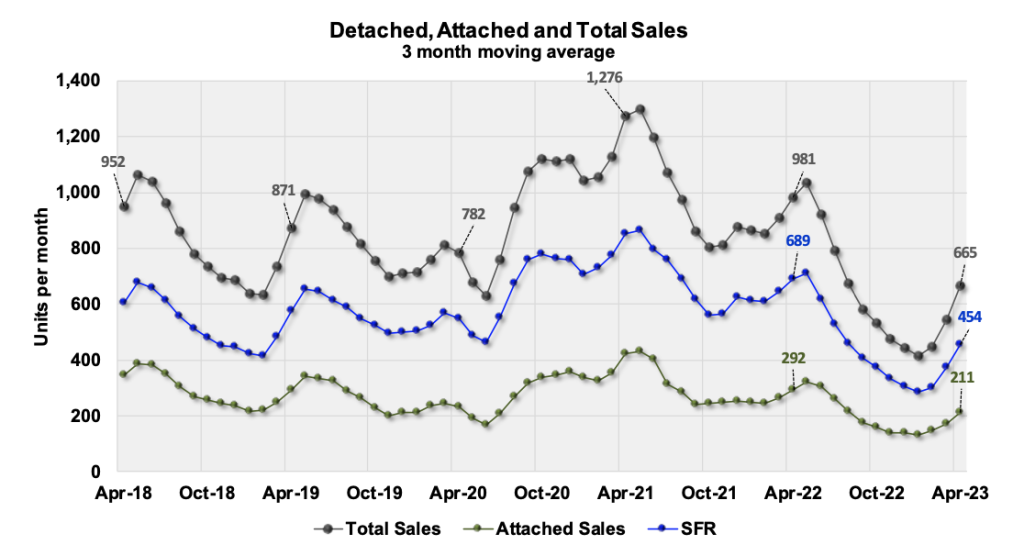
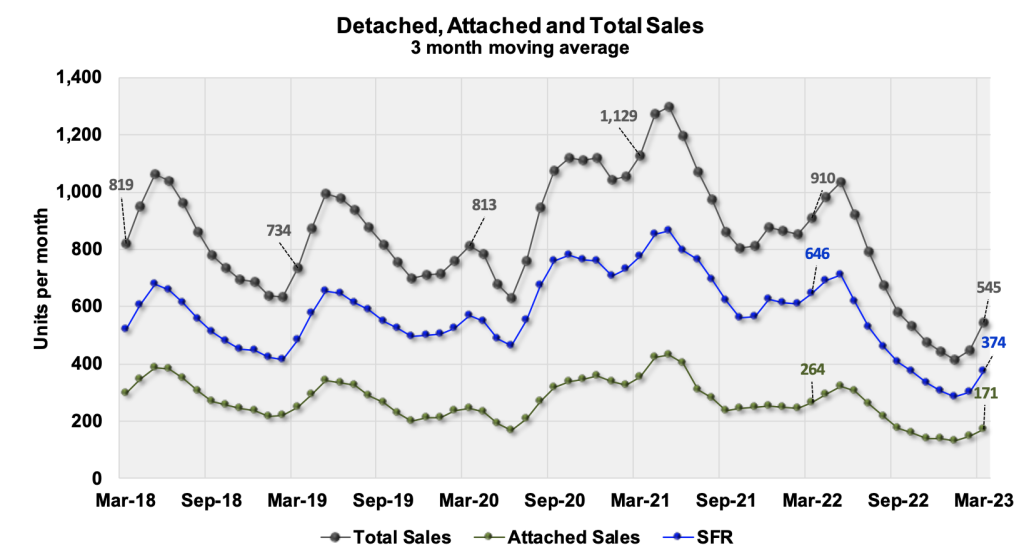
Home Sales
For another month, three-month sales are ahead of last year. The number this January was 510 units sold, compared to 436 units a year ago. Sales in January are now running 28.6% below normal, which is an improvement from last month. The city with the largest percentage increase in sales is Rancho Mirage with sales up 38%, followed by Coachella at 35%, then La Quinta with sales up 28%. With lower inflation and lower mortgage rates, we hope to see sales finally back to normal later this year.
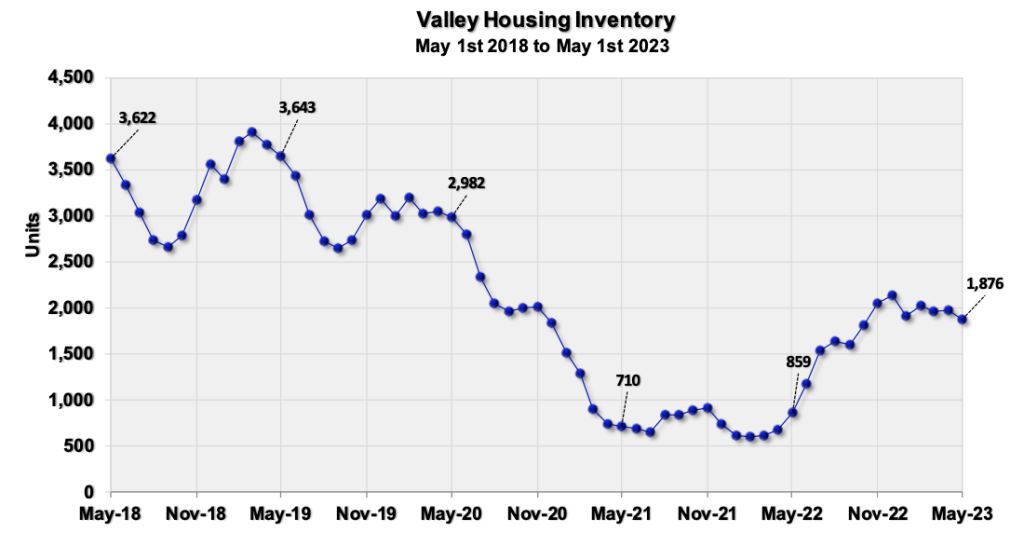
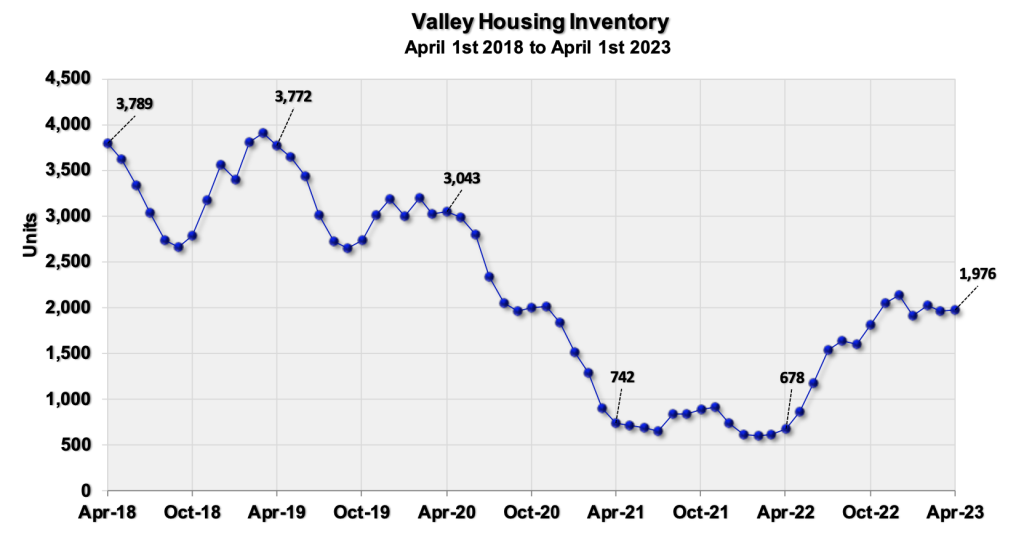
Our Inventory
Valley inventory rose to the highest levels since 2020, and on February 1st it stood at 2,309 units. While this is a distinct improvement, it is still 1,000 units under what’s considered normal for this time of year. On February 1st, the Valley’s “months of sales” ratio was 3.7 months, which is .8 months higher than last year.
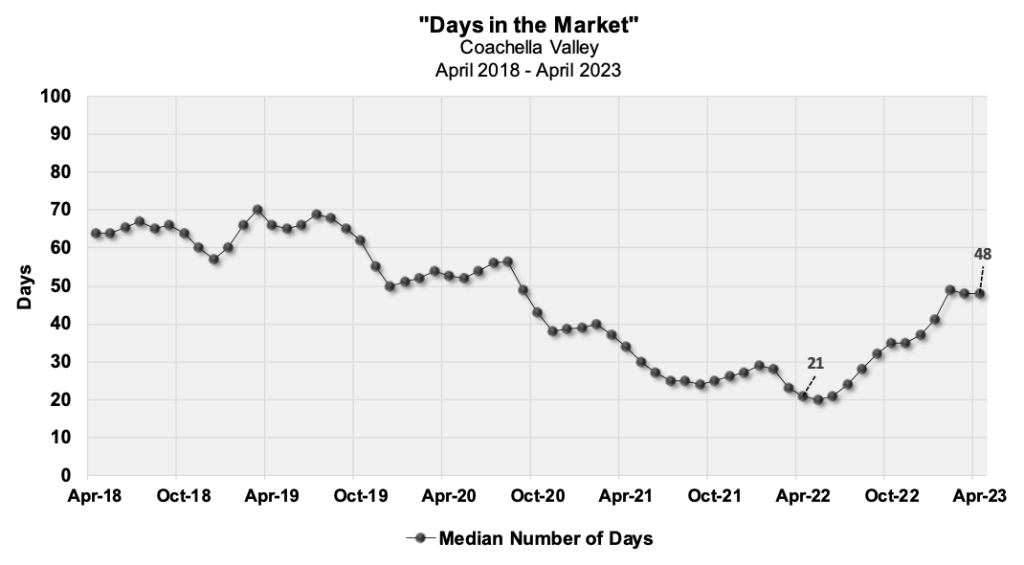
“Days on Market”
At the end of January, the median number of “days in the market” in the Coachella Valley was 40 days, which is equal to last year. The City of Coachella continues to have the lowest median selling time for detached homes at 26 days, followed by Desert Hot Springs at 30 days, then Indian Wells at 36 days. In the attached market, Indio has the shortest average selling time at 23 days, followed by Desert Hot Springs at 35 days and Palm Springs at 39 days.

In January, the percentage of homes selling over the list declined a little, with 14.0% of all sales selling above the list price. This is exactly one out of every seven sales. Every city has an average selling discount for detached homes, which ranges from 1.4% in the City of Coachella to 4.8% in Bermuda Dunes. Discounts for attached homes range from 1.1% in Cathedral City to 5.3% in Bermuda Dunes.
If you or someone you know is looking to buy, sell or invest in real estate here in the beautiful and serene Coachella Valley, please give me a call at 323.646.8558. I will be honored to represent you and/or them at the highest level while committed to your health and safety.
FOR FREE HOME EVALUATION CLICK HERE!
Coachella Valley Housing Report – February 2024
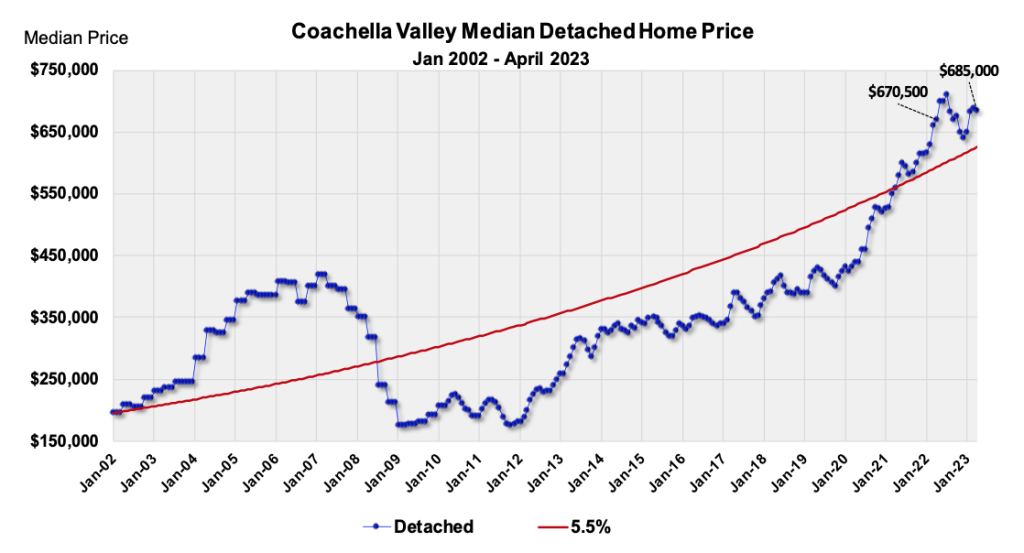
The median price of a detached home in the Coachella Valley in February was $680,500, up $20,500 for the month and 1.2% year over year. The median attached price in the Valley ended February at $488,250, up 12.7% year over year. Price changes for detached homes in each city continue to show broad variance. Changes range from a 16.7% year over year gain in Indian Wells to a decline of 7.6% in Cathedral City. Four cities had gains for their average size attached home – Indio, Indian Wells, Cathedral City and Palm Springs.
Home Sales
For another month, three-month sales are ahead of last year. The number this February was 518 units per month, compared to 474 units a year ago. Sales this month are 24.3% below normal, which is an improvement from the previous month. For another month, every city except Cathedral City, Desert Hot Springs and Indian Wells had higher three-month sales compared to last year. The cities with the largest increase percentage-wise are Coachella and Rancho Mirage with sales up 38%, followed by La Quinta up 30%.
Our Inventory
On May 1st, Valley inventory was On March 1st, Valley inventory was 2,416 units, which is the largest number in almost four years. While inventory has improved, this number is still about 1,000 units under what was normal in March before the pandemic. The Valley’s “months of sales” ratio at the end of the month was 3.9 months, which is one month higher than last year and somewhat normal for this time of year.
“Days on Market”
At the end of February, the median number of “days in the market” in the Coachella Valley was 44 days, which is slightly less than last year. The City of Coachella continues to have the lowest median selling time for detached homes at 30 days, followed by Desert Hot Springs at 36 days and Indian Wells at 39 days. In the attached market, Indio has the shortest average selling time at 24 days, followed by La Quinta at 33 days and Desert Hot Springs at 35.
In February, the percent of homes selling over list price was 13.5%. This percent is just marginally higher than last year, which was 12.3%. Every city is selling detached homes now at an average discount, which range from a discount of .4% in the City of Coachella to 4.4% in Bermuda Dunes. Average discounts for attached homes range from 1.9% in Cathedral City to 6.1% in Bermuda Dunes.
If you or someone you know is looking to buy, sell or invest in real estate here in the beautiful and serene Coachella Valley, please give me a call at 323.646.8558. I will be honored to represent you and/or them at the highest level while committed to your health and safety.
FOR FREE HOME EVALUATION CLICK HERE!
Coachella Valley Housing Report – March 2024
The median price of a detached home in the Coachella Valley in March was exactly $700,000, up 2.2% year over year. The median attached price was $500,000, up 8.7%. Changes in city prices of the average size home ranged from a 21.7% gain in Indian Wells to a decline of 5.9% in Desert Hot Springs. Six cities have year-over-year gains for their average size attached home.
Homes Sales
For another month, three-month sales were more than last year. This month sales averaged 633 units compared to 577 units a year ago. Every city except Desert Hot Springs and Indio had higher three-month sales compared to last year. The cities with the largest percentage-wise increase in sales are Indian Wells and Palm Springs, with sales increases of 49% and 23%, respectively.
Our Inventory
On April 1st, Valley inventory was 2,450 units, which is the highest number of units for sale since June 2020. While improved, this number is still 500 to 1,000 units less than historic norms. The Valley’s “months of sales” ratio was 3.9 months, which is .8 higher than last year. Every city but Coachella has a ratio over three months, with four cities now having ratios over four months. A ratio of three to four months is considered normal. The current even distribution of ratios by price range indicates that supply and demand remain balanced throughout the region.
Days on Market
At the end of March, the median number of “days in the market” in the Coachella Valley was 42 days, which is two days less than last year. The City of Coachella has the smallest median selling time for detached homes at 31 days, followed by Indian Wells at 38 days. In the attached market, Bermuda Dunes has the shortest average selling time at 16 days, followed by Indio and Rancho Mirage at 35 days.
If you or someone you know is looking to buy, sell or invest in real estate here in the beautiful and serene Coachella Valley, please give me a call at 323.646.8558. I will be honored to represent you and/or them at the highest level while committed to your health and safety.
FOR FREE HOME EVALUATION CLICK HERE!
Coachella Valley Housing Report – April 2024

The median price of a detached home in the Coachella Valley in April reached an all-time record of $724,523, up 6.6% year over year. The median attached price in the Valley ended April at $500,000, up 4.2% year over year. Year-over-year price changes of detached homes in April range from an 18.2% gain in Indian Wells to a decline of 4.2% in Desert Hot Springs. Price changes of average-size attached homes range from 7.6% in Indio to -11.4% in Indian Wells.
Homes Sales

Three-month sales are ahead of last year but only by twelve units. The number this April was 716 units per month, compared to 704 units a year ago. Sales this month are 19.8% below normal, which is another improvement from the previous month. Dollar sales in April were $669 million, which is 11% higher than last year. The largest dollar sales increase is in homes priced over $1,000,000. Most brackets show comparable sales to a year ago except in homes under $400,000. This is positive since it shows the housing market is well-balanced in most price ranges.
Our Inventory

On May 1st, Valley inventory was 2,597 units, which is the highest number in almost four years. While inventory has improved, this number continues to be about 1,000 units under what was normal before the pandemic. The Valley’s “months of sales” ratio was 4.2 months, which is 1.2 months more than last year. We are pleased to that most cities have ratios between three and four months. This consistency is a good sign.
Days on Market
At the end of April, the median number of “days on the market” in the Coachella Valley was 44 days, which is one day more than last year. This includes both detached and attached homes. The city of Coachella continues to have the lowest average selling time at 27 days. This is followed by Palm Springs at 40 days and Indian Wells at 41. Bermuda Dunes has the highest average selling time at 54 days.
Currently, both detached and attached homes in the region have average selling discounts of 2.3% and 2.6%, respectively. Desert Hot Springs has the lowest selling discount for detached homes at .4%, while the highest average discount is 3.8% in both Rancho Mirage and Bermuda Dunes. One out of seven homes is now selling for a premium in the Valley.
If you or someone you know is looking to buy, sell or invest in real estate here in the beautiful and serene Coachella Valley, please give me a call at 323.646.8558. I will be honored to represent you and/or them at the highest level while committed to your health and safety.
FOR FREE HOME EVALUATION CLICK HERE!